Demographics
The International Charter School values the diversity of our community.
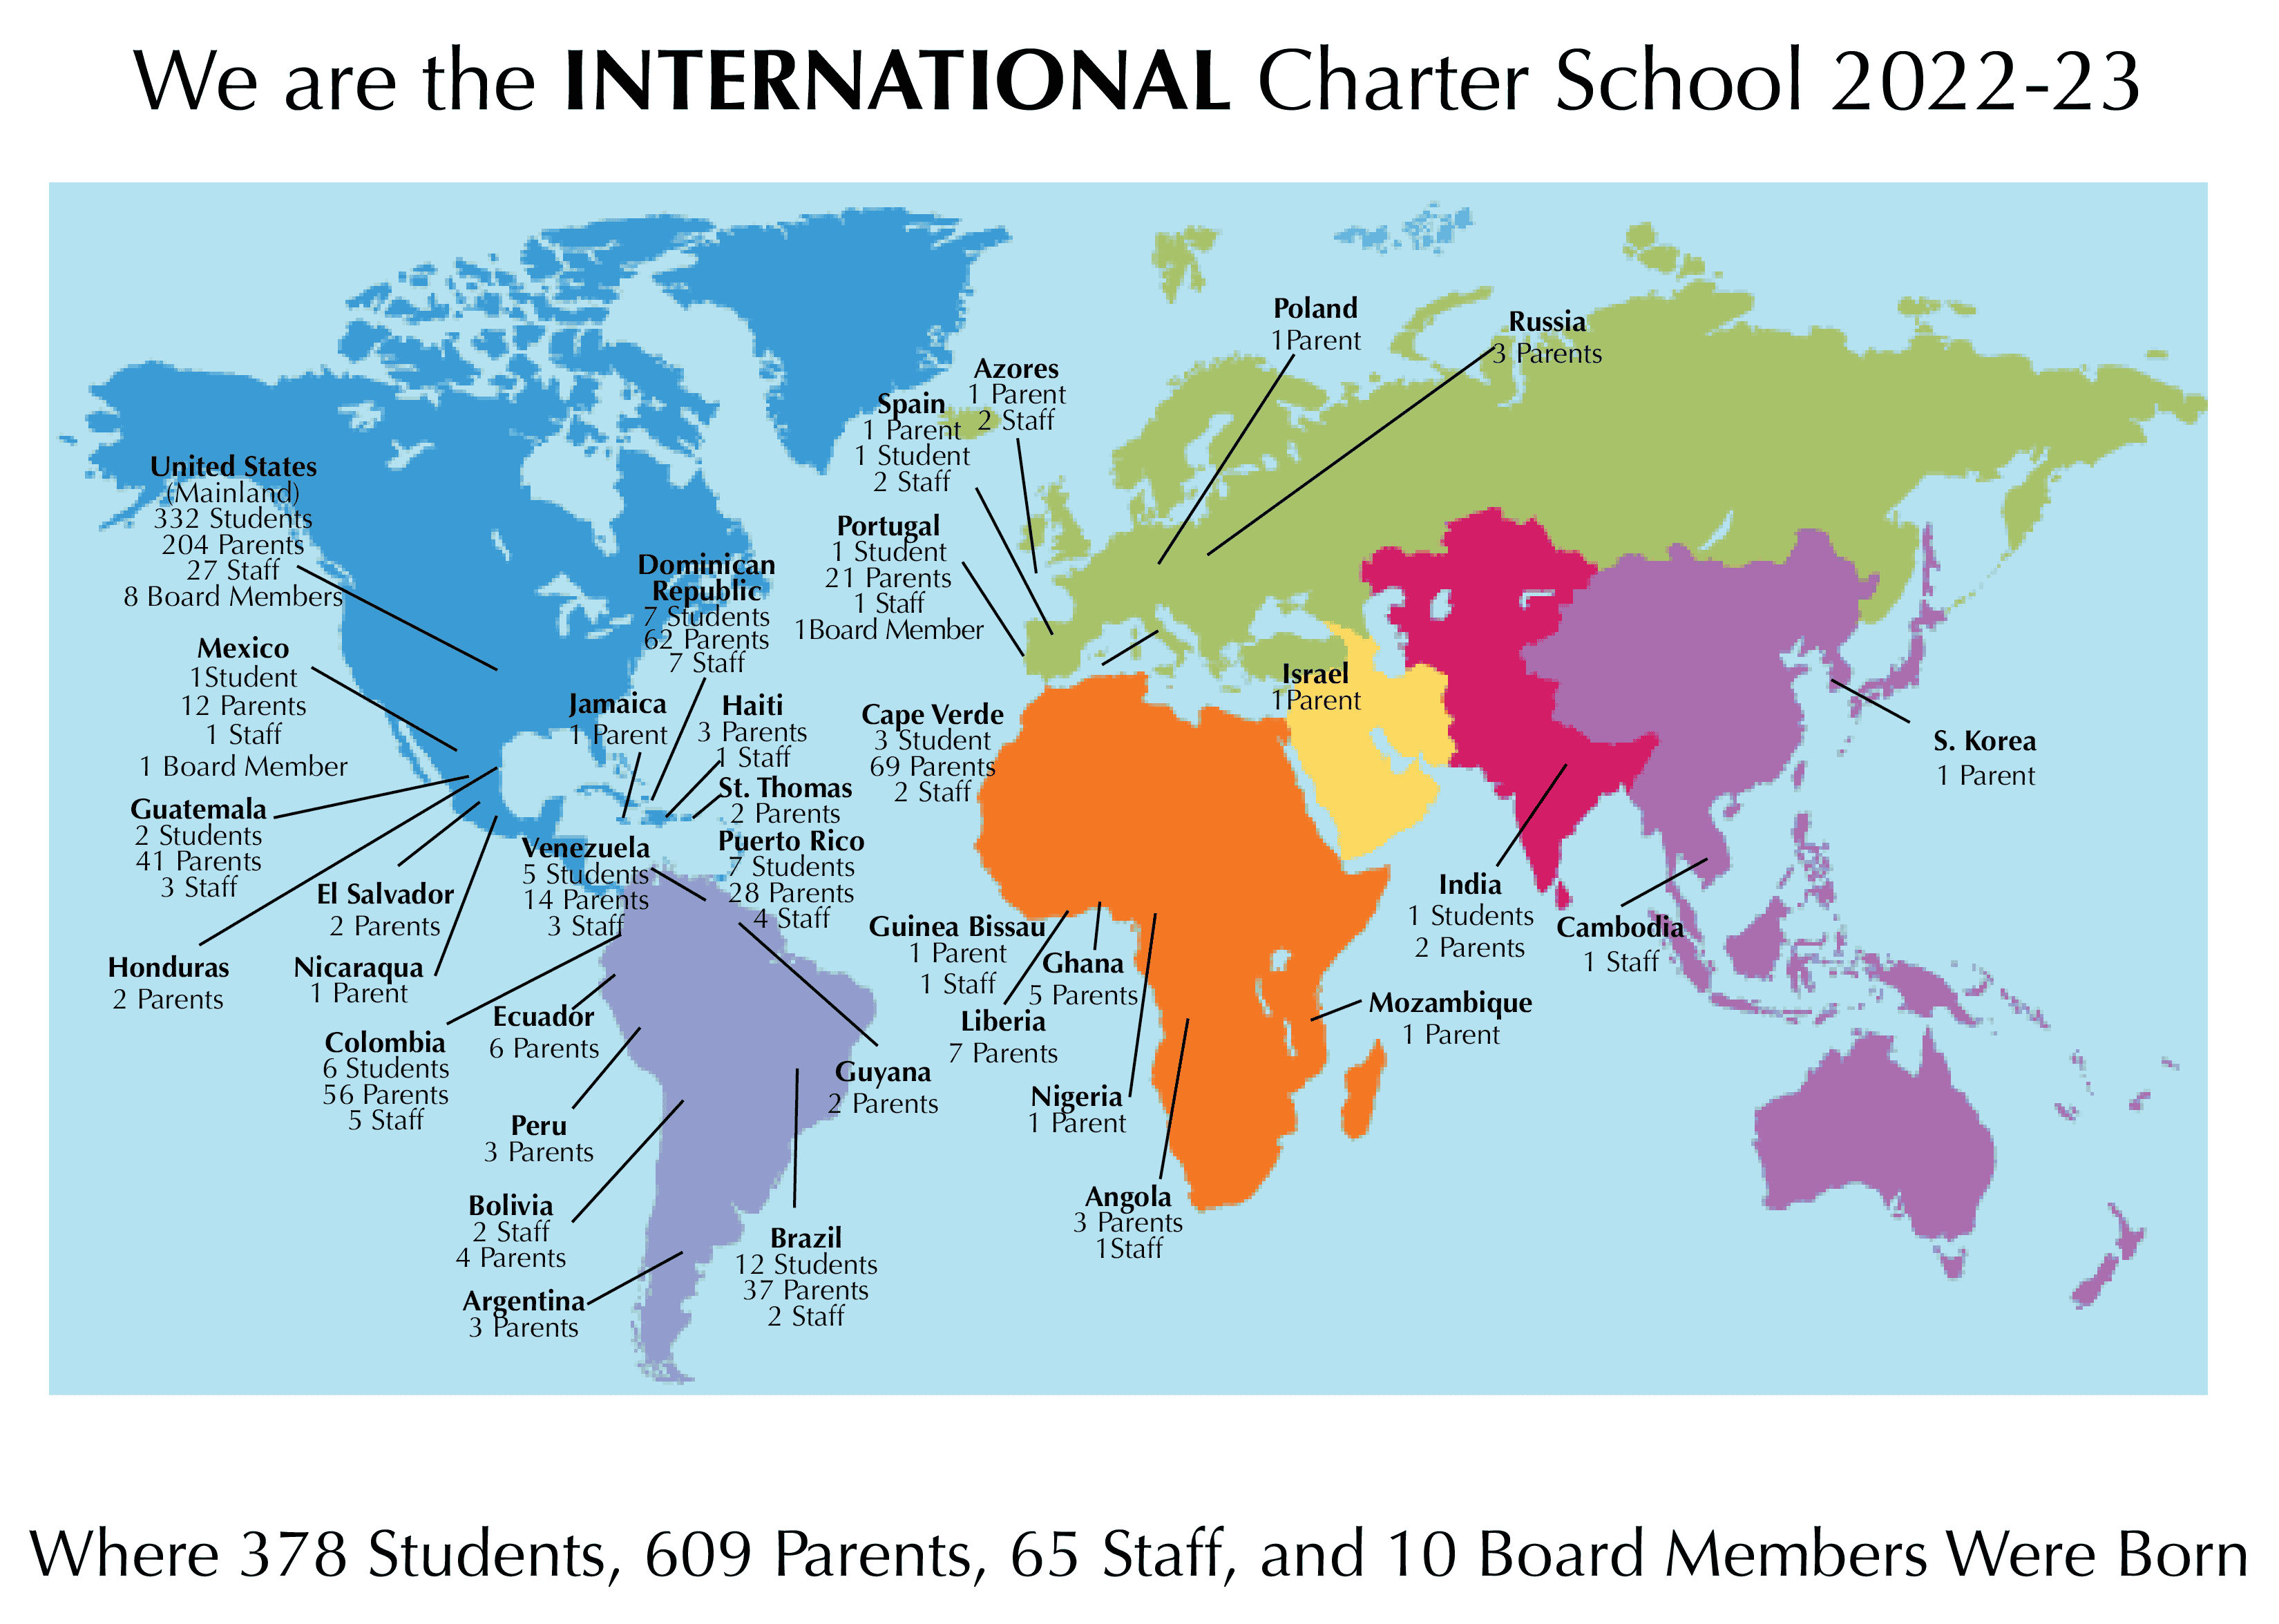
Stats About ICS:
12%
12% of our students were born outside the United States, including Brazil, Cape Verde, Colombia, Dominican Republic, Ecuador, Guatemala, India, Mexico, Portugal, Puerto Rico, Spain, and Venezuela
51/49
51% of our students arrive at ICS dominant in Portuguese or Spanish, and 49% are dominant in English
Our students also speak Cape Verdean, Kriol, French, Tamil, and Wolof
11%
11% of our students have an Individual Education Plan (IEP)
14
%
60% of our students are Latinx, 28% White, 20% African-American, 1% Asian, and 1% Native American
54%
54% of our students qualify for free or reduced-price meals
60%
60% of ICS teachers and staff are native speakers of languages other than English
Language Dominance
Ethinicity
Reduced-Price Meals
15%
15%
15% of our students have an Individual Education Plan (IEP)
14
60%
60% of ICS teachers and staff are native speakers of languages other than English